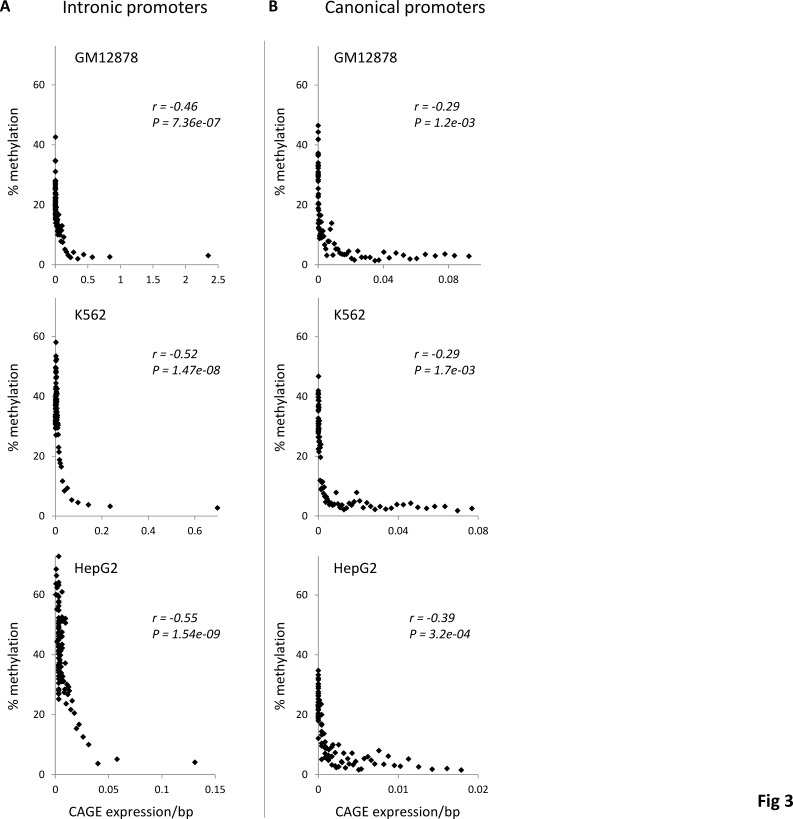
Figure 3. Relationship between DNA methylation and promoter activity levels.
Percent DNA methylation levels are regressed against CAGE expression levels (i.e. promoter activity) for (A) intronic and (B) canonical 5’ gene promoters. Genes are grouped into 100 gene expression bins. Pearson correlation coefficient values (r) along with their significance values (P) are shown for each regression.

