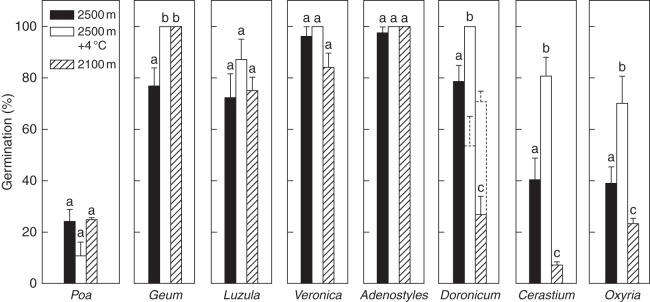
Fig. 3.
Percentage germination (means ± s.e.) of each species at the end of the three temperature treatments listed in Table 1, performed in the absence of an autumn simulation. Also shown are the same results after subzero winter temperature (–7 °C, dashed columns), but only if significantly different from the winter-treated seeds performed at 0 °C. Winter germination has been omitted because no seeds had germinated during incubation at this temperature. Different letters indicate significant differences of germination at P < 0·05 level (Tukey multiple comparison test).

