
Figure 4.
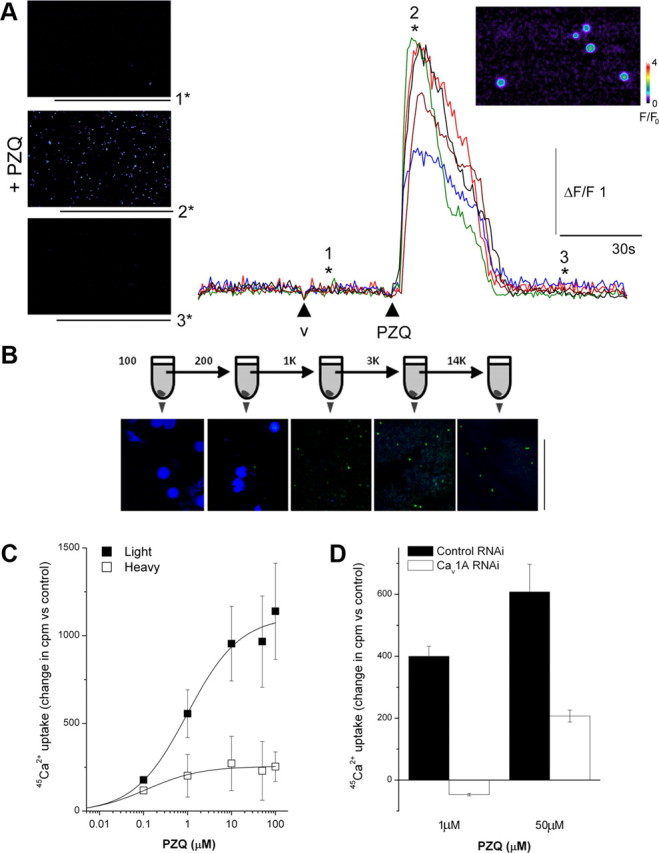
PZQ activates Ca2+ entry via Cav1A channels. A, Left, Confocal Ca2+ imaging of dissociated planarian cells depicting fluo-4 fluorescence on application of control vehicle (image “1”), as well as during (“2”) and after (“3”) application of PZQ (100 μm). Right, Traces show fluorescence profiles from five discrete cells, with the time points of images as indicated (v = vehicle). Inset, Higher-magnification image of responsive cells from which fluorescence profiles were collected (position “2*”). Fluo-4 fluorescence is represented on a pseudocolor scale where increasing warm coloration represents greater fluorescence emission. Fluorescence (F) and change in fluorescence (ΔF) are calibrated relative to fluorescence at time = 0 (F0). B, Schematic of serial centrifugation protocol. The dissociated planarian suspension was first spun at 100 × g to yield a pellet, which was retained for staining, while the supernatant was spun at the next higher speed. This procedure was repeated up to a final step at 14,000 × g. The constituents of the pellet was visualized at each stage using DAPI (blue) and NeuroTrace (green). Scale bar, 50 μm. C, Comparison of 45Ca2+ uptake in response to increasing concentrations of PZQ in equivalent “light” (solid) and “heavy” fraction samples (open) in the same preparation. D, Cav1A RNAi inhibited absolute 45Ca2+ uptake in response to submaximal (1 μm) and maximal (50 μm) concentrations of PZQ. Data are generated from the “light” fraction and expressed relative to untreated samples from the same preparative fractionation.