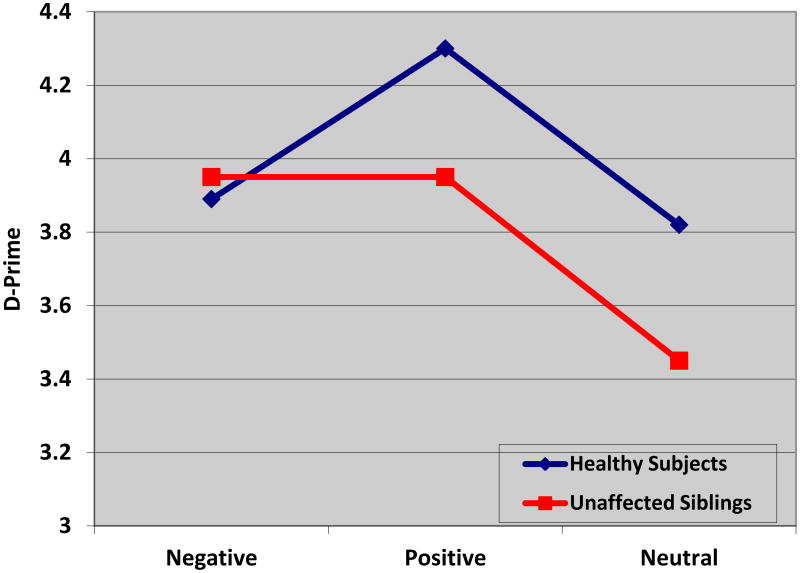
Figure 1. Group Performance on Affective Go/No-Go Accuracy (D′) × Condition.
The X-axis indicates the three conditions of the Affective Go/No-Go task and the Y-axis depicts the value of D-prime. The blue line represents unrelated healthy controls (n=20) and the red line represents the unaffected siblings (n=20). The results indicate no significant differences in accuracy of performance on any of the conditions.

