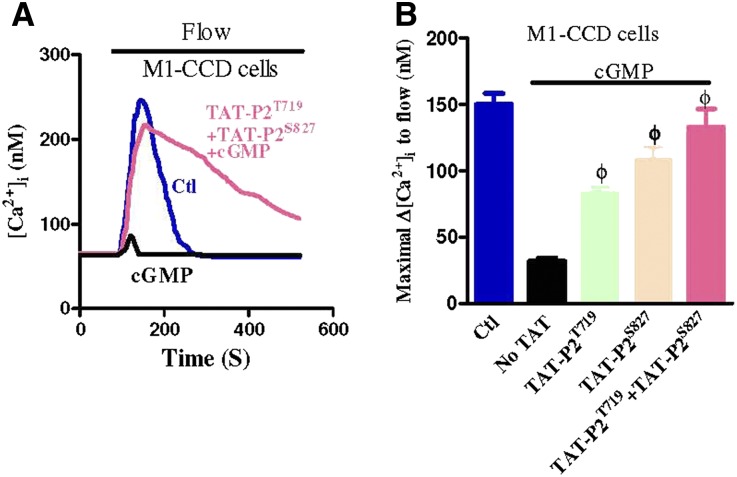
Figure 6.
PKG phosphorylation sites in M1-CCD cells. (A) Representative traces illustrating the time course of flow-induced [Ca2+]i responses. (B) Summary showing the maximal change in flow-induced [Ca2+]i responses (Δ[Ca2+]i). All cells were bathed in NPSS containing 1% BSA. Cells were pretreated with 8-Br-cGMP (2 mM) with or without TAT-P2T719 (100 nM) and/or TAT-P2S827 (100 nM) for 10 minutes before flow. Data are given as the mean ± SE (n=6–8 experiments and 8–20 cells per experiment). ΦP<0.01 versus 8-Br-cGMP.

