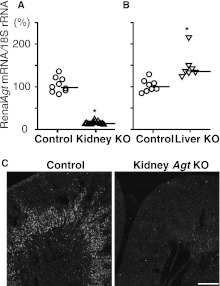
Figure 1.
Renal Agt mRNA in kidney Agt KO mice and liver Agt KO mice versus control mice. (A and B) Real-time RT-PCR analyses for Agt mRNA/18S rRNA. *P<0.05 compared with the control group. Bars represent median values. In kidney Agt KO mice, Agt mRNA is markedly low compared with control mice. In liver Agt KO mice, renal Agt mRNA is significantly increased. (C) In situ hybridization for Agt mRNA. In control kidneys, Agt mRNA is expressed in the outer stripe of the outer medulla. In kidney Agt KO mice, the signal is almost absent. Scale bar, 0.5 mm.

