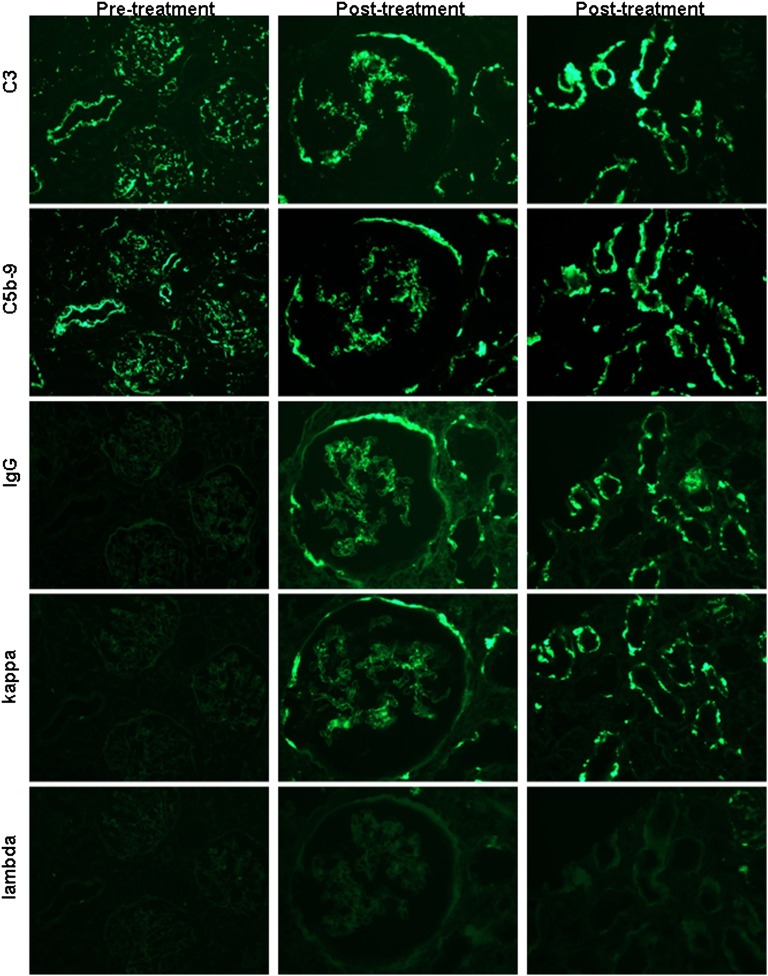
Figure 2.
A representative panel of serial sections from patient C3GN3 illustrates the evolution of staining for C3, C5b-9, IgG, κ light chain, and λ light chain in pretreatment and post-treatment biopsies. Column 1 shows pretreatment findings in a low-power (×200) view of three glomeruli and an interlobular artery, which demonstrate positivity for C3 and C5b-9, but no staining for IgG or either light chain. Columns 2 (×400; glomerulus) and 3 (×600; tubules) illustrate post-treatment biopsy findings, with the persistence of C3 and C5b-9 in glomerular tufts, Bowman’s capsules, and TBMs, as well as the new appearance of positivity for IgG and κ (with negative λ) in the same distribution.

