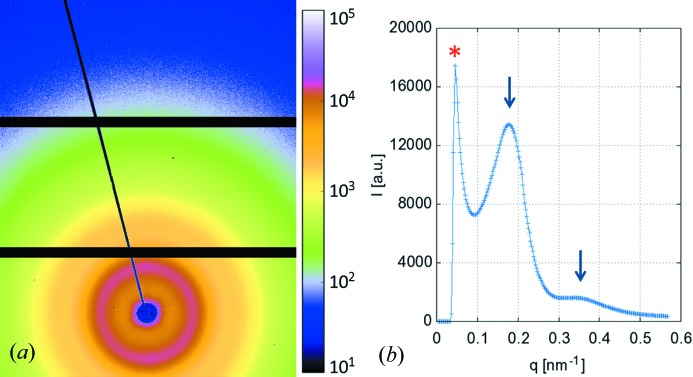
Figure 7.
(a) Two-dimensional µSAXS data of a polyethylene (LUPOLEN) calibration sample. (b) Azimuthal integrated intensity. The vertical arrows highlight the positions of the first-order and second-order maxima of the LUPOLEN calibration sample. The SAXS resolution is imposed by the beamstop size as indicated by the star (*) at q = 0.05 ± 0.01 nm−1.

