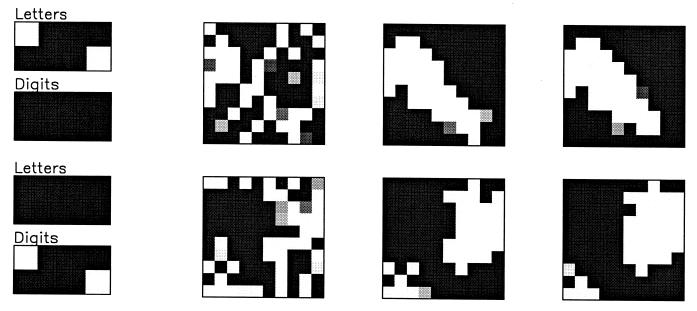
Figure 2.
The state of the network after 1, 3, and 5 processing cycles when a pair of letters is presented (top row) and when a pair of digits is presented (bottom row) (7). The input layer is on the left, and state of the output layer after 1, 3, and 5 processing cycles is on the right. [Reproduced with permission from ref. 7 (Copyright 1995, Proceedings of the National Academy of Sciences)].

