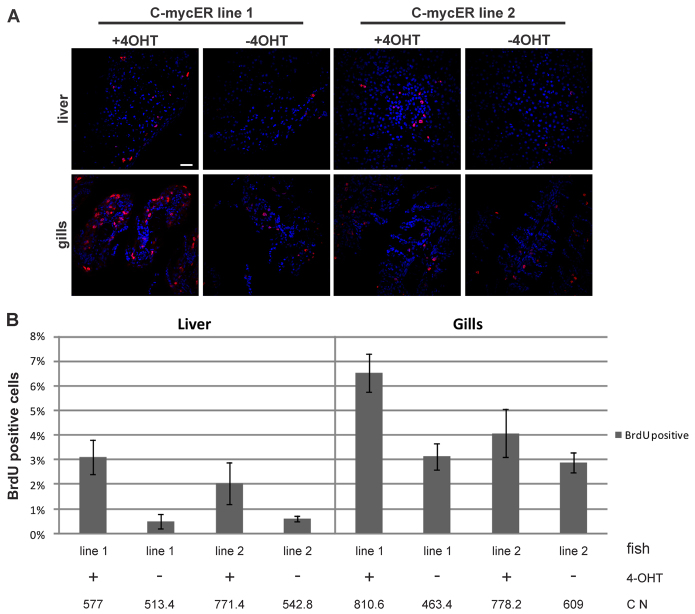
Fig. 4.
Cell proliferation after myc17 activation in vivo. (A) BrdU staining on sections of liver (upper panels) and gills (lower panels) in the presence or absence of 4-OHT. Scale bar: 10 μm. (B) Quantification of BrdU-positive cells in liver (left graphic) and gills (right graphic) in both myc17ER lines. Histograms with T-bars indicate the mean percentage of BrdU-positive cells of two independent experiments with their corresponding standard deviation. C N indicates average cell number counted from five different sections.

