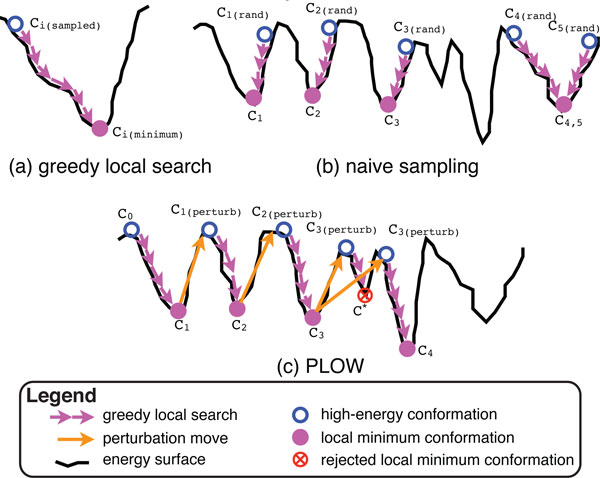
Figure 2.
The figure illustrates (a) greedy local search, (b) naive sampling, and (c) PLOW on a simplified energy surface. (a) A sampled conformation Ci(sampled) (empty blue circle) is mapped to the nearest local minimum Ci(minimum) (solid purple circle) by a greedy local search (series of short purple arrows). (b) 5 points sampled at random (empty blue circles) by the naive sampling approach are each mapped to a nearby local minimum (solid purple circles) by a greedy local search (series of short purple arrows). (c) PLOW begins at C0 (leftmost empty blue circle). Through a series of perturbations (long orange arrows) and greedy local searches (short purple arrows), PLOW samples conformations representative of local minima (C1 through C4) in the energy surface.

