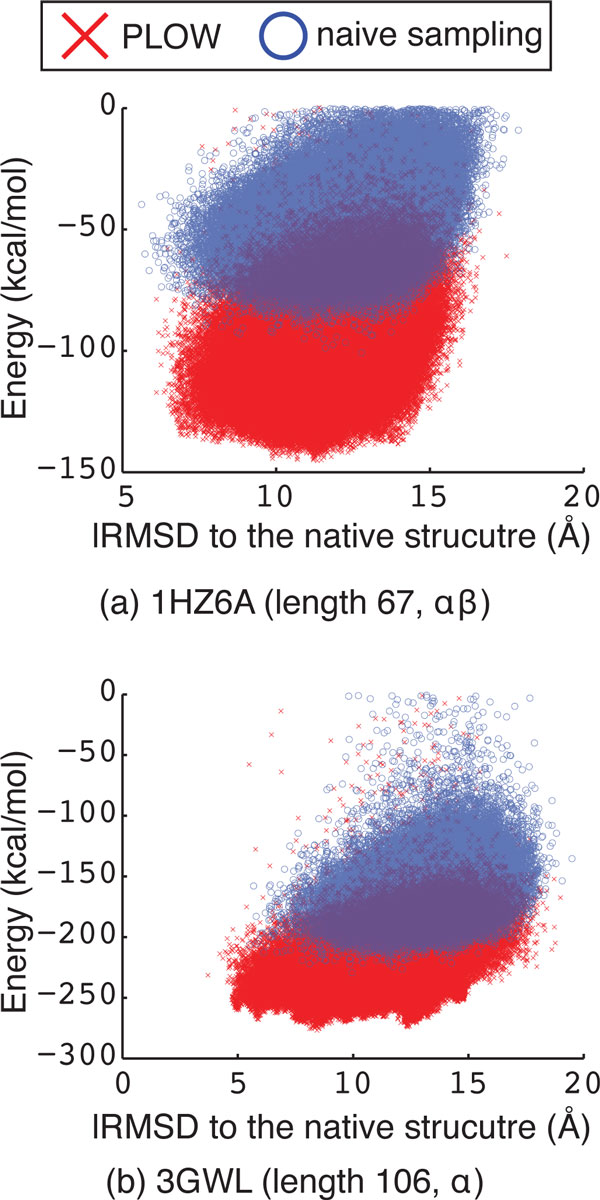
Figure 3.
Potential energy is plotted against lRMSD to the native structure for all conformations representative of sampled local minima. Results obtained by the naive sampling approach (blue "o") are superimposed over those obtained by PLOW (red "x"). (a) shows results obtained for the protein system with PDB id 1HZ6A. (b) shows the results the protein system with PDB id 3GWL.

