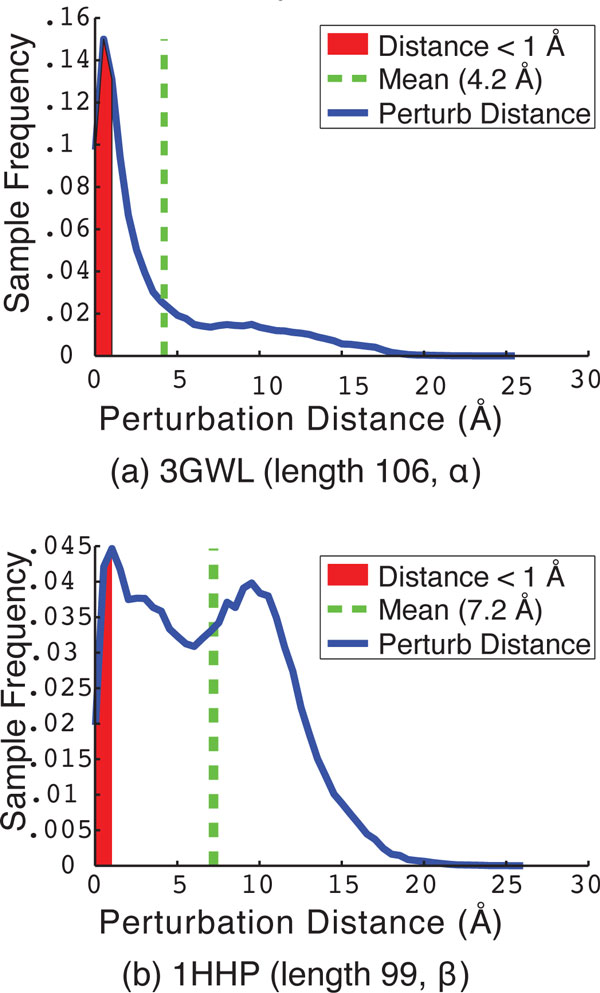
Figure 5.
The distribution of perturbation distances, between Ci and Ci(perturb), is shown for two selected proteins with PDB ids 3GWL in (a) and 1HHP in (b). The area shaded in red represents the cases where the perturbation distance between Ci and Ci(perturb) is less than 1Å lRMSD and is thus deemed an insignificant change from the conformation Ci.

