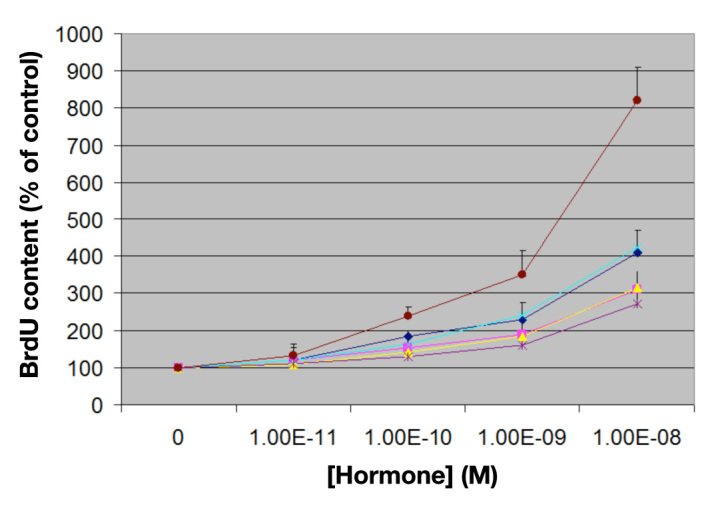
Figure A1.

Mitogenicity studies of MCF-7 human breast-cancer-derived cell line. Relative changes in BrdU content after 5 days in culture (vertical axis) are shown as a function of hormone concentration (horizontal axis). From top to bottom: (maroon) human IGF-I; (light blue) AspB10-insulin; (dark blue) [HisA8, AspB10, AspB28, ProB29]-insulin; (yellow) SCI-57; (pink) KP-insulin; and (purple) wild-type insulin. Error bars indicate standard deviation of triplicate determinations. Statistical p values are provided in Table A1. [HisA8, AspB10, AspB28, ProB29]-insulin corresponds to the insulin core of SCI-57 and so provides a two-chain control. KP-insulin designates [LysB28, ProB29]-insulin, the active component of Humalog.
