
Figure 3.
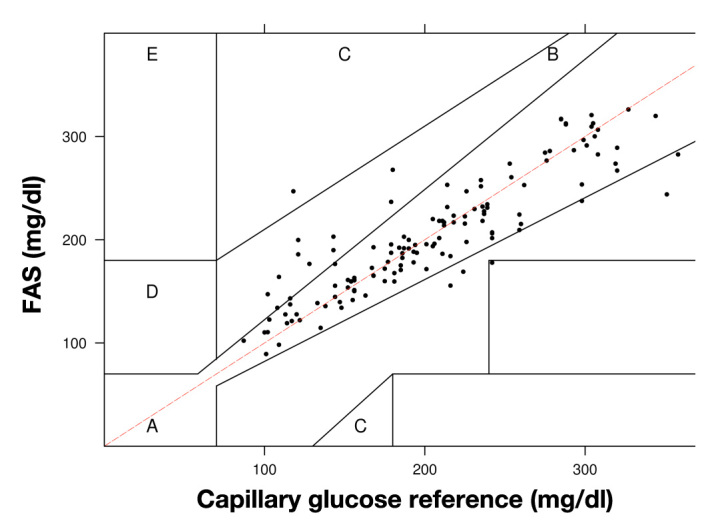
Clarke error grid analysis of capillary glucose reference and FAS readings. Data pairs (n = 132) were obtained from 17 sensors implanted in 12 subjects with diabetes type 1 or 2. The range of reference blood glucose levels was 100–350 mg/dl.