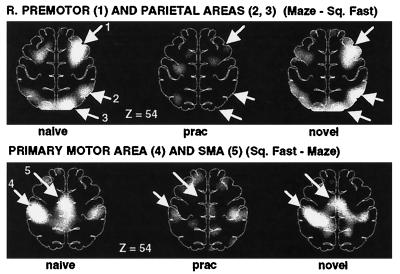
Figure 7.
PET difference (subtraction) images showing areas of increased (Upper images) and decreased (Lower images) blood flow when maze tracing (under Naive, Practiced, and Novel conditions) is compared with fast square tracing. During naive (Left images) and novel (Right images) maze tracing, increased blood flow in right premotor and parietal areas was found compared with square tracing, whereas decreased blood flow was observed in primary and supplementary motor cortex. The Center images show that blood flow in these areas changed to a level almost identical to that found during simple square tracing after the maze was practiced. A linear gray scale is used, with white representing maximal activation and black, minimal activation. The brain outlines were traced from the stereotaxic atlas of Talairach and Tournoux (20) and represent a transverse section 54 mm above the AC–PC line.

