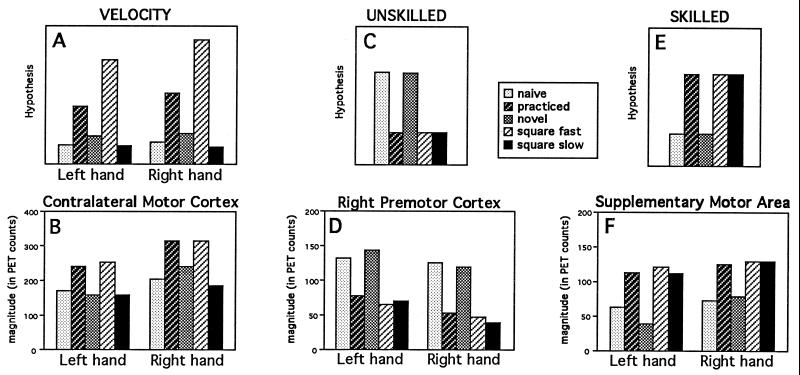
Figure 9.
Absolute magnitudes in hypothetical brain areas (Upper three graphs) during the five tracing conditions minus the control rest condition and in brain areas of interest (Lower three graphs) in areas with activations related to velocity (A and B), to unskilled performance (C and D), and to skilled performance (E and F).

