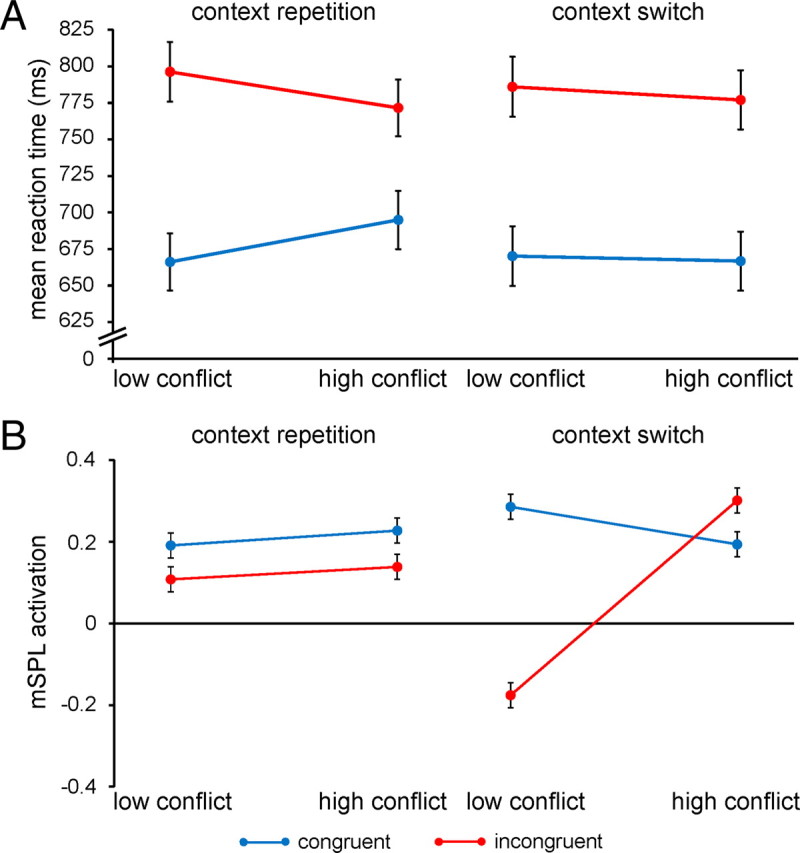
Figure 5.

Conflict-control settings are primed by contextual cues. A, Group mean RTs (±SEM) are plotted for congruent and incongruent trials as a function of conflict frequency context, separately for context repetitions and context switches. B, Group mean right mSPL activation (β estimates ± SEM) is plotted as in A.
