
Figure 1.
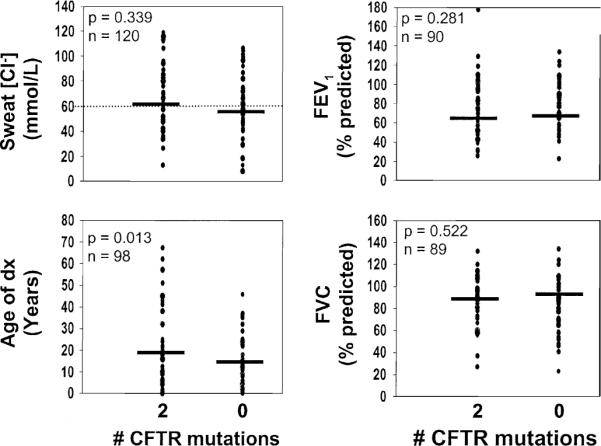
Comparison of quantitative features among patients with two or zero CFTR mutations. Each data point represents a value from a single patient, and horizontal bars indicate mean values. The diagnostic cutoff for sweat chloride concentration is shown with the horizontal dotted line.