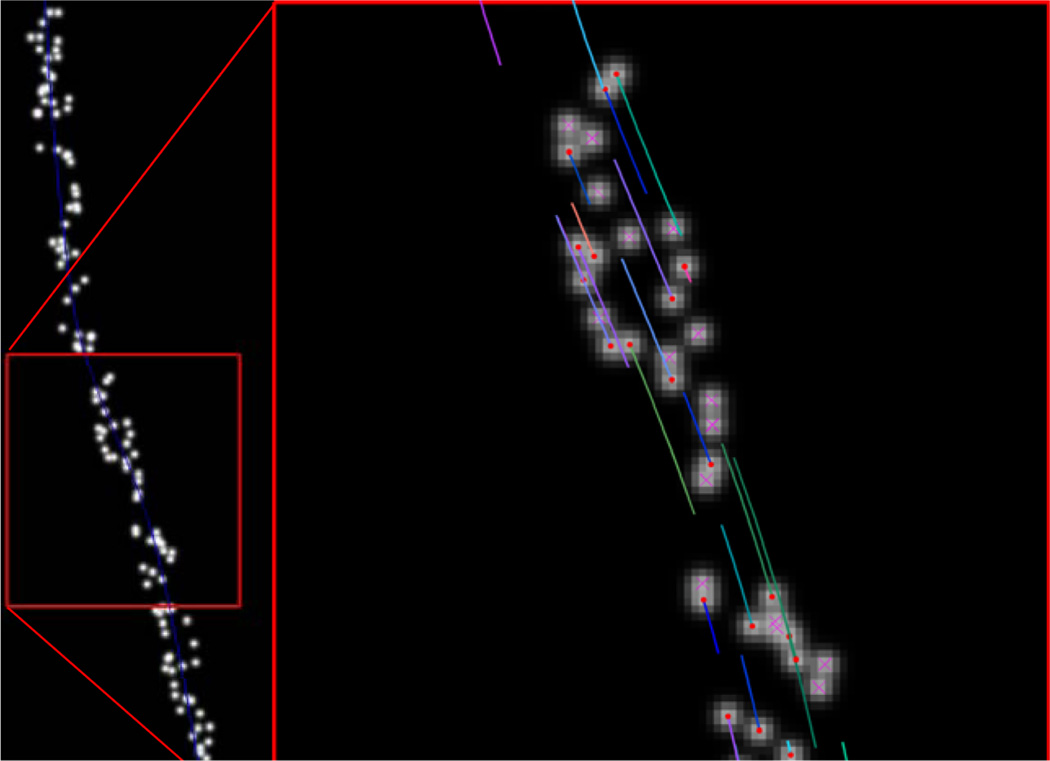
Figure 2.
Single frame of phantom data. (left) All detections generated within 8-pixels of a phantom axon (blue line). (right) Zoom view showing true objects with organelle centres (red dots) and tails indicating direction and magnitude of velocity. False detections are marked with a magenta ‘x’ (see online version for colours)

