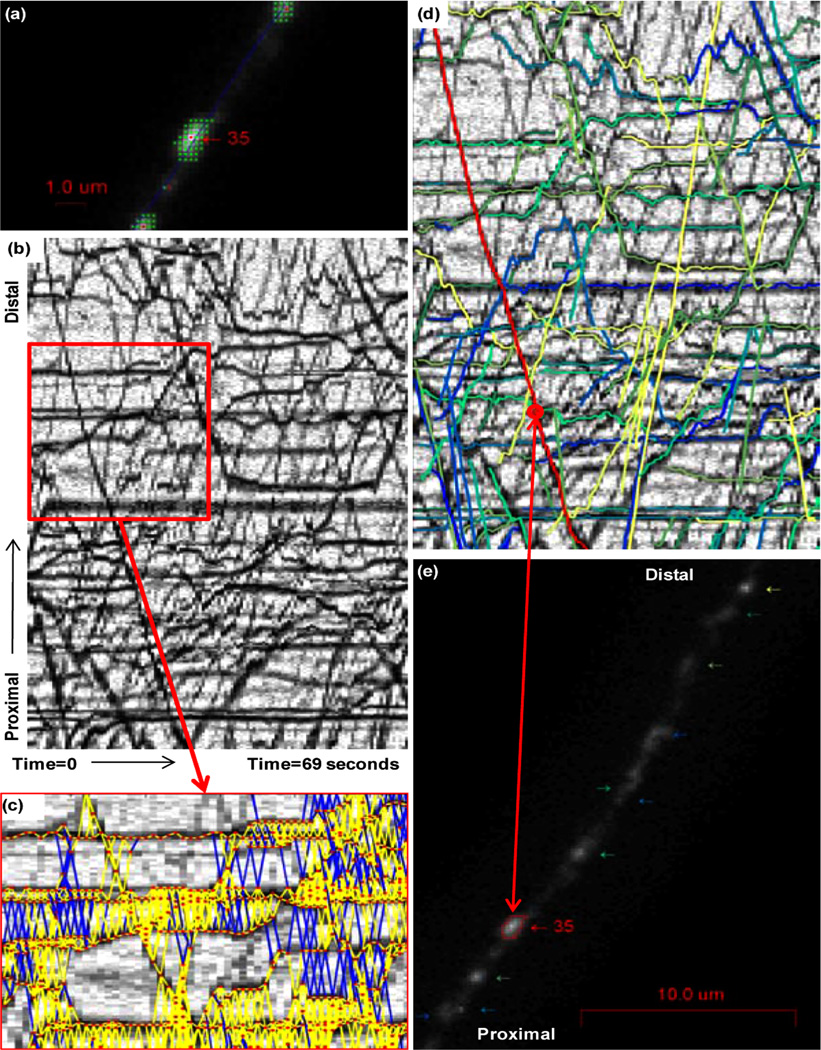
Figure 4.
Segmentation of ssNPY organelles, peaks (red) and connected components (green), the blue line is the axonal centreline used to generate the kymograph (a). Kymograph generated from pretreatment ssNPY organelle image sequence; (b). Blur distance constraints projected onto a portion of the kymograph, detections (red), satisfied constraints (yellow), and outside blur constraint (blue) (c). Pretreatment ssNPY tracks overlaid on the kymograph, example track highlighted in red (d). Axon image with arrows pointing to tracked organelles and an example organelle track highlighted and labelled (e) (see online version for colours)

