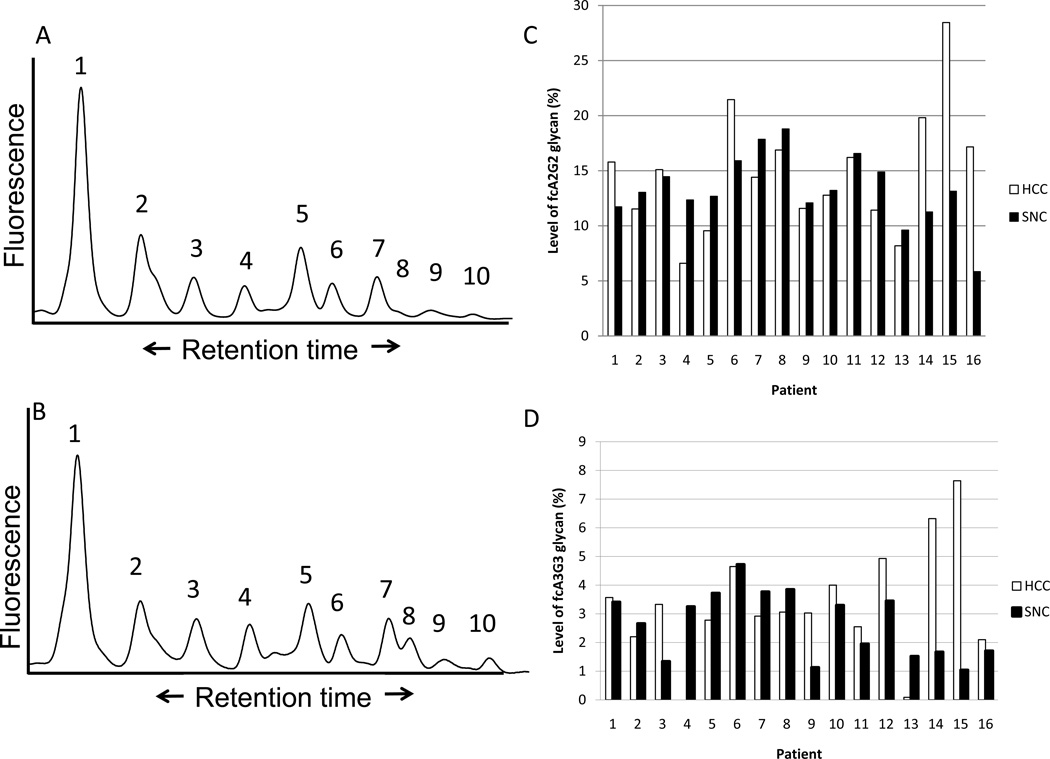
Figure 1.
N-linked glycosylation of total protein from representative HCC tissue and adjacent liver tissue. Desialylated N-linked glycan profile of representative adjacent liver tissue (panel A) or HCC tissue (panel B) from one matched pair. Identified species are indicated as follows, using terminology described elsewhere (45): Peak 1, A2G2; Peak 2, F(6)A2G2; Peak 3, M7; Peak 4, A3G3; Peak 5, co-migrating M8 and F(6)A3G3; Peak 7, M9; Peak 8, A4G4; Peak 9, F(6)A4G4. Peaks 6 and 10 are incompletely characterized, although peak 6 contains one or more structures containing outer arm fucose. C) The level of the F(6)A2G2 glycan in the matched pairs of tissue. The % of the F(6)A2G2 glycan as a function of the total glycan profile is shown. D) The level of the F(6)A3G3 glycan in the matched pairs of tissue. As with (C), the % of the F(6)A3G3 glycan is a function of the total glycan profile.

