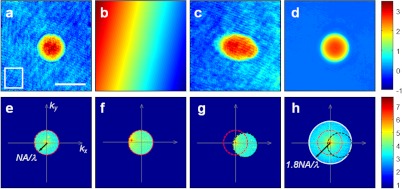
Fig. 2.
Angle-dependent complex field images and an aperture synthesized image. (a, e) Phase image taken in the image plane and the intensity distribution in the Fourier plane for zero-degree illumination. A 10 μm polystyrene bead is used as a sample. (b, f) Same as (a, e) for illumination angle of 50.9-deg. (c, g) Same as (b, f) after background subtraction. (d, h) Same as (a, e) but after aperture synthesis. Color bars indicate phase in radians for (a), (b), (c), and (d), and intensity in the logarithmic scale with base 10 for (e), (f), (g), and (h). Scale bar: 10 μm. Red and black circles in (e), (f), and (g) indicate passband with their radii corresponding to spatial frequencies of and white circle in corresponds to .

