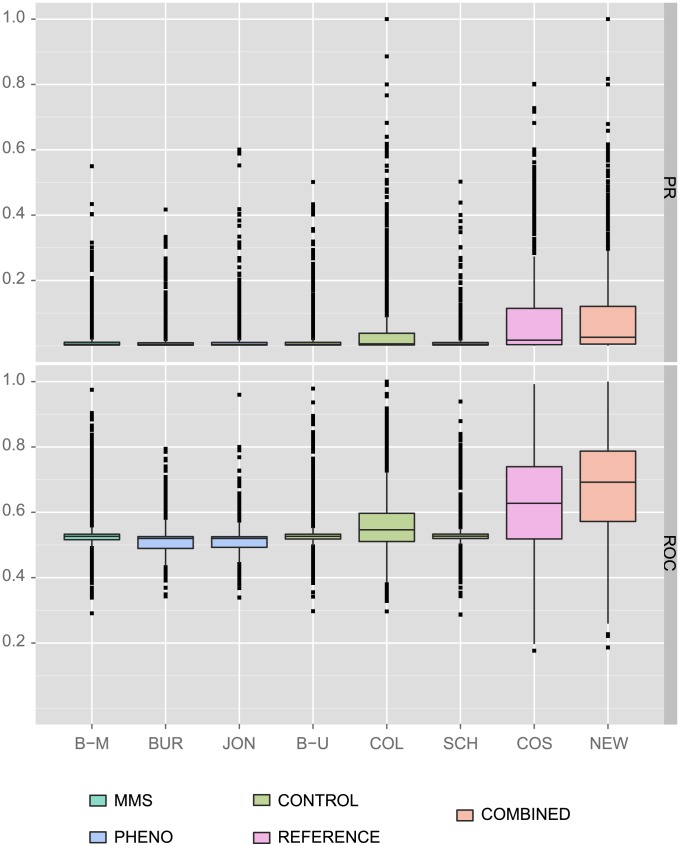
Figure 5. Gene function prediction results on full independent and combined networks.
The boxplots show the area under the receiver operating characteristic (ROC) curves obtained when predicting gene function with the GeneMANIA algorithm on the Gene Ontology categories for the networks separately and after combination, using all available genes and interactions (full networks): B–M Bandyopadhyay et al. [9] in MMS, B–U Bandyopadhyay et al. [9] untreated, BUR Burston et al. [5], JON Jonikas et al. [14], SCH Schuldiner et al. [16], COL Collins et al. [15], COS Costanzo et al. [3], NEW the combined network.

