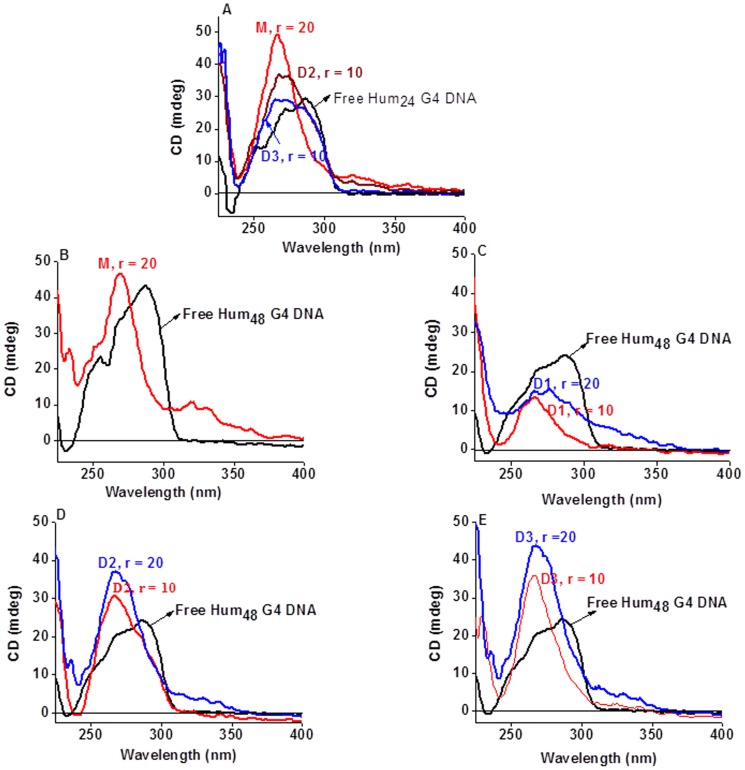
Figure 3. Evidence of change in Topology of the G4DNA using CD spectroscopy.
(Panel A) CD spectral profiles of free G4DNA derived from the Hum24 DNA (4 µM, black) and G4DNA formed in presence of the indicated ligand in KCl solution. (Panels B to E) CD spectral profiles of free G4DNA derived from the Hum48 DNA (black, 4 µM in the case of ‘B’ while 2 µM in other cases) and G4DNA formed in presence of the indicated ligand. Solution (10 mM Tris, pH 7.4 having 100 mM KCl), with or without the ligands, was first heated to 100°C for 5 min and then cooled slowly to room temperature to form the G4DNA in each case.

