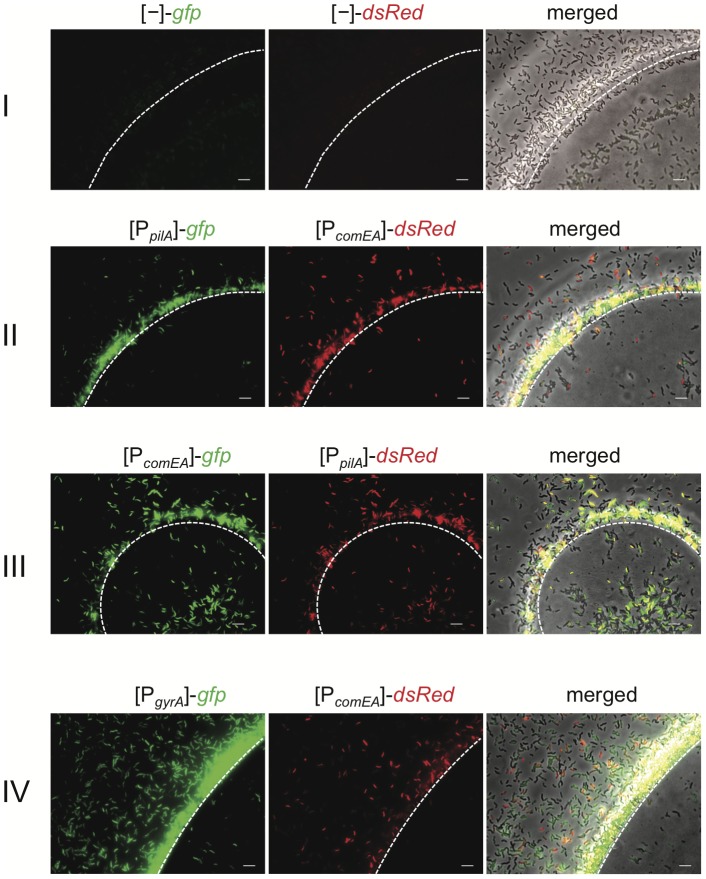
Figure 1. Visualization of competence gene expression on chitin surfaces.
V. cholerae cells were grown on chitin beads as previously described [23]. The white dashed line notes the edge of the chitin surface. The bacteria carried diverse transcriptional FP reporter fusions. I: vector control containing promoter-less gfp and dsRed; II: plasmid containing gfp driven by the pilA promoter and dsRed downstream of the comEA promoter region; III: swapped reporter genes in comparison to II; IV: plasmid containing gfp driven by the gyrA promoter and dsRed driven by the comEA promoter. Bacteria were grown statically for 48 h before pictures were taken. The order of the images here and in the following figures is (from left to right): green channel (GFP), red channel (dsRed), and merged image composed of a phase contrast image overlaid by both fluorescence channel images. Scale bar = 5 µm.

