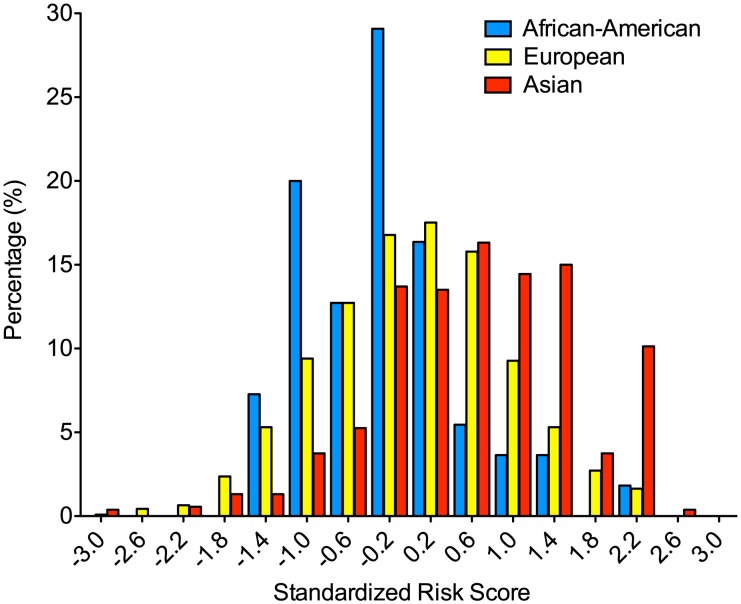
Figure 2. Differences in the distribution of the 7-SNP genetic risk score by ethnicity.
Only healthy control participants of the replication studies that were fully genotyped at all 7 loci were used in this analysis. Similar to the GWAS study, the risk score distributions were significantly different by ethnicity (ANOVA p = 2.1×10−38). The corresponding differences in the distribution of risk alleles are depicted in Figure S1.

