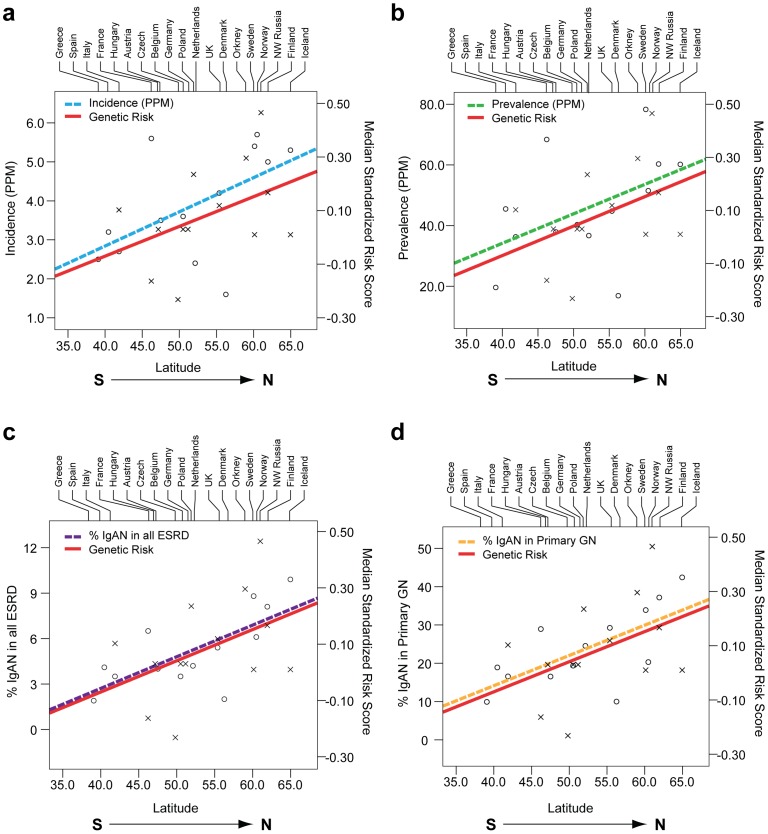
Figure 4. Correlation of average country latitude with country-specific genetic risk and IgAN–attributable ESRD across the European continent.
The South to North latitude is indicated on the X-axis. The median genetic risk (x) is indicated on the right Y-axis. The following incidence and prevalence metrics (o) are indicated on the left Y-axis: (panel a) the incidence of ESRD due to IgAN per million population (correlation with latitude: r = 0.54, p = 0.05); (panel b) the prevalence of ESRD due to IgAN per million population (correlation with latitude: r = 0.47, p = 0.10); (panel c) the percent of IgAN patients among all ESRD cases (correlation with latitude: r = 0.67, p = 0.01); and (panel d) among ESRD cases due to primary glomerular disease (correlation with latitude: r = 0.71, p = 0.006). All p-values are derived based on a two-sided hypothesis test.

