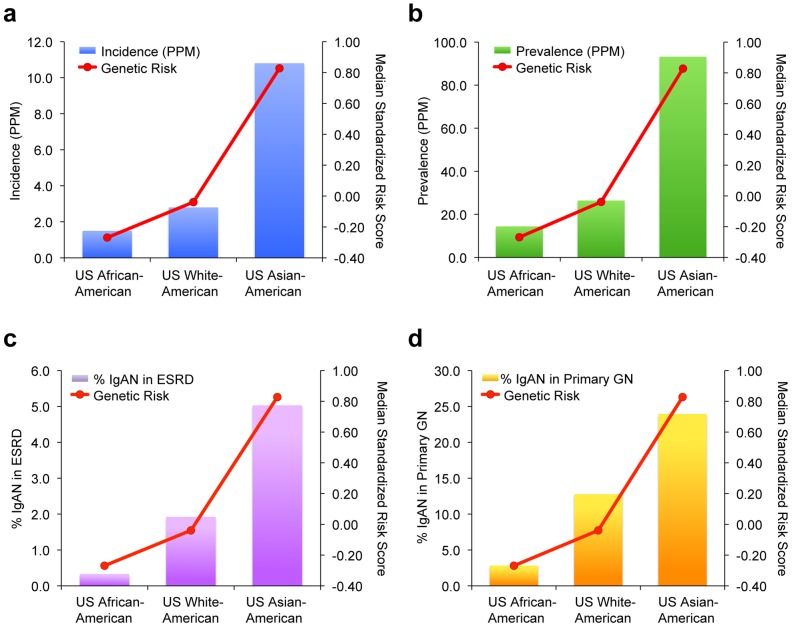
Figure 6. Genetic risk and IgAN–attributable ESRD among major US ethnicities.
The relationship between IgAN risk scores (red line) and IgAN incidence and prevalence (bars) among US ethnicities are shown. The following metrics of IgAN occurrence are depicted: (panel a) the incidence of ESRD due to IgAN per million population by ethnicity, (panel b) the prevalence of ESRD due to IgAN per million population by ethnicity, (panel c) percent of IgAN among the total ESRD population by ethnicity; and (panel d) percent of IgAN among ESRD due to glomerular disease by ethnicity.

