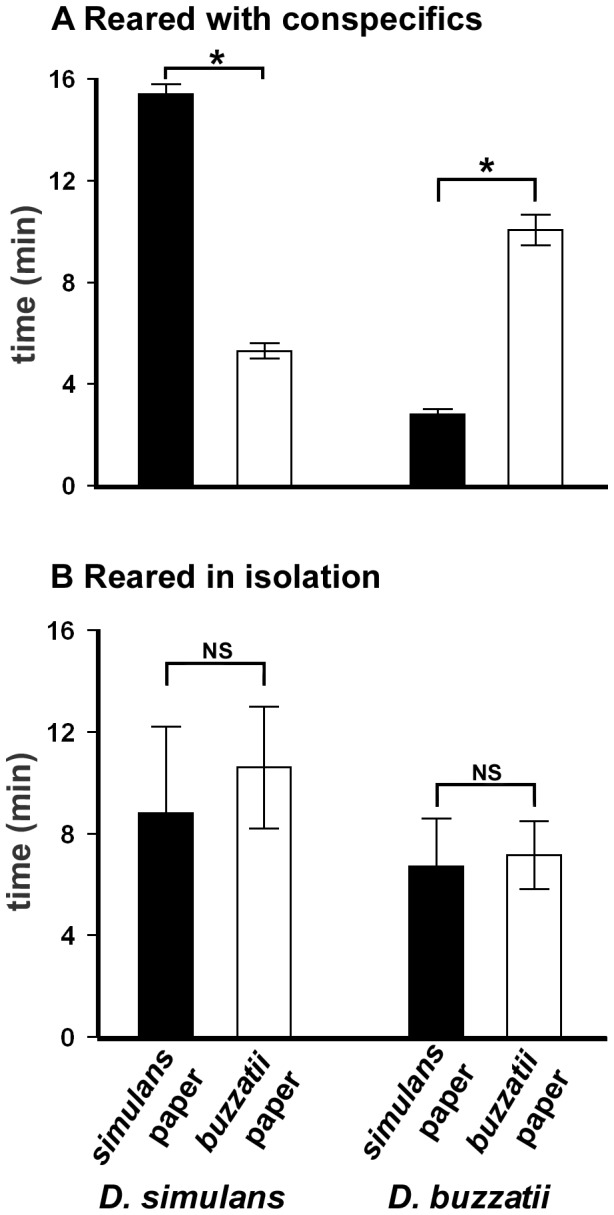
Figure 3. Mean ± S.E., of pupae of D. simulans and D. buzzatii on conspecific and heterospecific papers.

The larvae were of third instar reared with conspecifics (Fig. 3a), and in isolation from conspecifics (Fig. 3b). The larvae were tested individually (N = 50 per species). Black columns, percentages of pupae on the simulans paper; white columns percentages of pupae on the buzzatii paper. *Mann-Whitney U-test; P<0.05; NS = non significant differences (see text for details).
