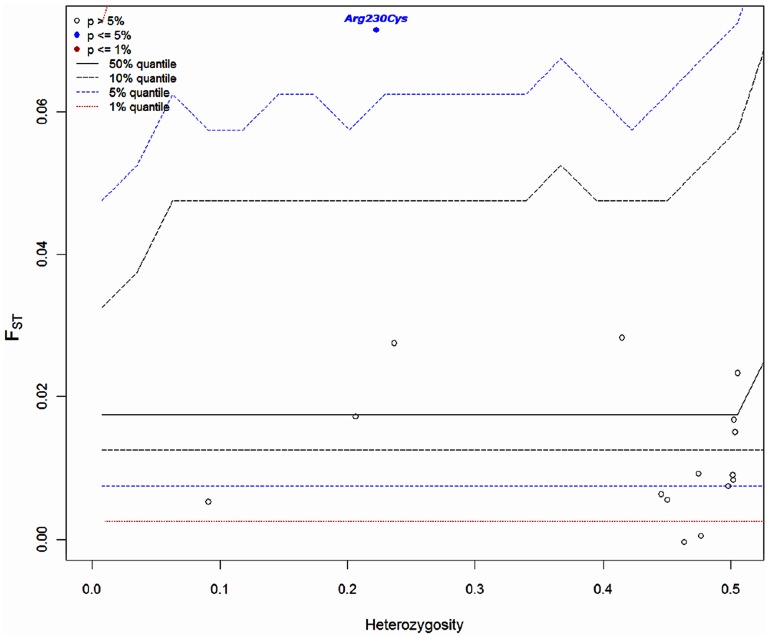
Figure 1. Plot of the joint FST and He distributions for the Mesoamerican agriculturalist versus South American (agriculturalists + hunter-gatherer/foraging) groups.
Each dot indicates a SNP (listed in item c.2 in the Materials and Methods section). The lines represent confidence intervals. Only the ABCA1 locus showed significance at the 5% level (filled blue circle). Five selected SNPs were not plotted in the figure because of monomorphic sites in all subdivisions, missing data, and/or dot superposition.

