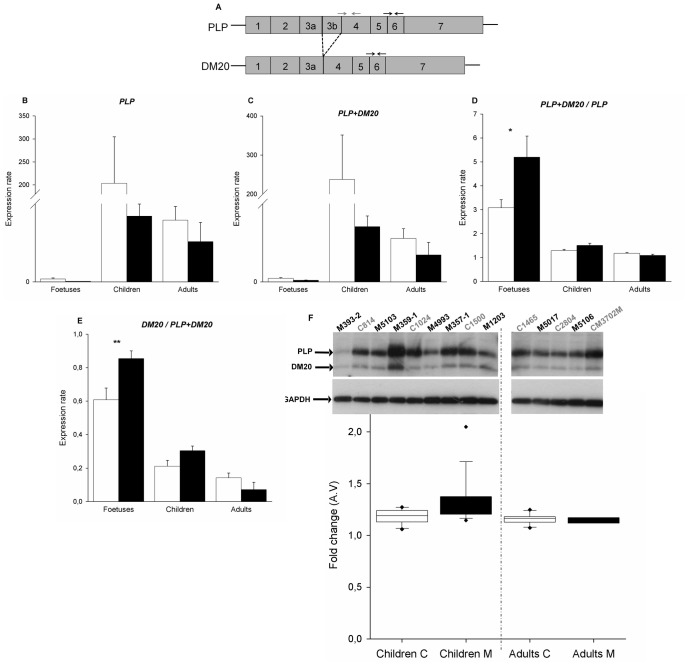
Figure 2. Study of the splice PLP/DM20 in eIF2B-mutated patients brains. A.
Transcripts of human PLP1 splice variants. The boxes represent the exons that are transcribed for the different isoforms. The black and grey arrows represent respectively common primers between PLP and DM20 (forward primer between the exons 5 and 6, reverse primer at the end of the exon 6), and specific primers for PLP (forward primer between the exons 3b and 4, reverse primer in the exon 4). B, C. RNA was isolated from control brains (white bars) vs eIF2B-mutated patient brains (black bars) and analyzed by quantitative RT-PCR for expression of PLP and PLP+DM20. Expression rates were calculated using the formula Mean (2∧-(Ct gene x − Ct B2M)) and ratio PLP+DM20/PLP was performed (D). E. Extrapolation of the DM20/PLP+DM20 ratio calculating DM20 alone by the formula (PLP+DM20)-PLP. Errors bars represent standard error (s.e.m.) (*P<0.05,**P<0.01, ***P<0.001).F. Proteins were extracted from controls and eIF2B-mutated patient brains and western blot analysis was performed on the cytoplasmic fractions using antibodies specific for PLP and DM20. GAPDH served as loading control. C: control, M: eIF2B-mutated. The images were quantified using ImageQuant TL software and the box plots below show the relative expression of PLP+DM20/PLP (corrected for GAPDH levels) in control and patients brains. A.V.: arbitrary value.

