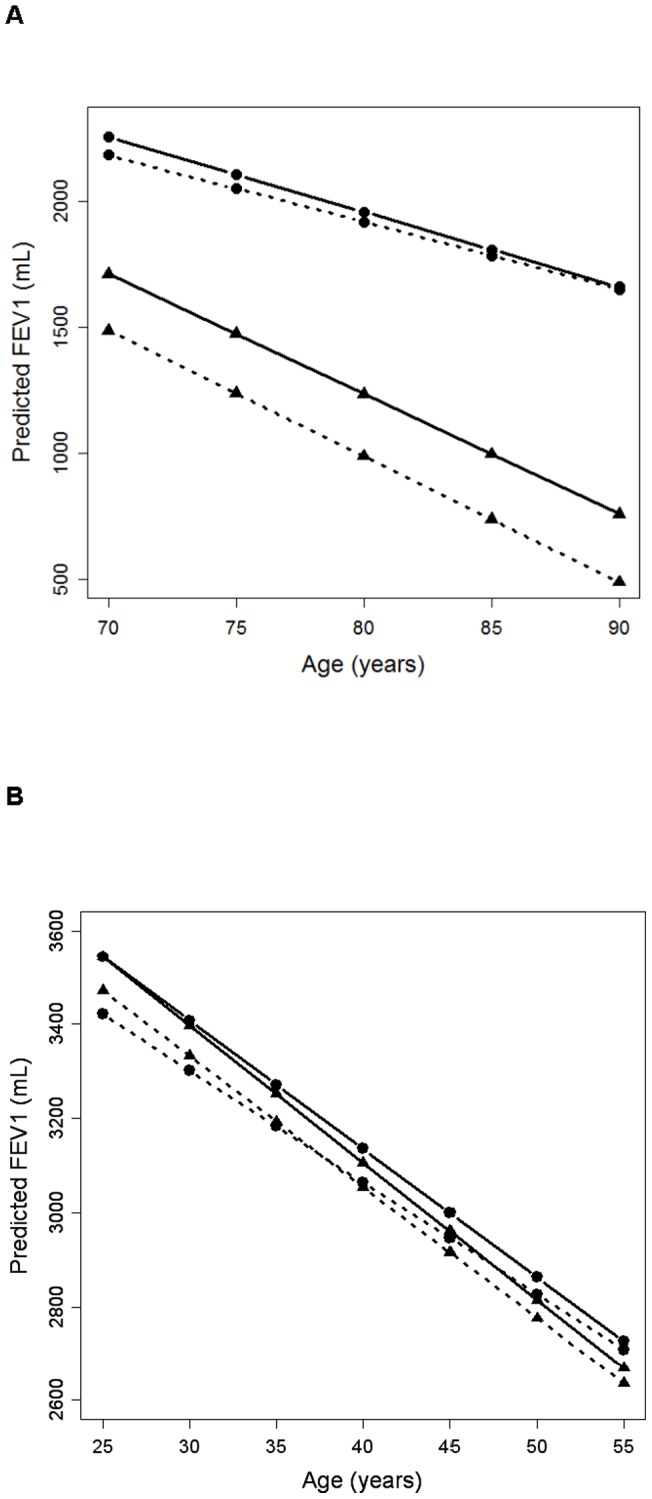
Figure 1. Predicted FEV1 decline (in milliliters) by smoking-ancestry strata derived from a mixed effects model.

Health ABC (A) and CARDIA (B). Current smokers are represented by the ▴ symbol and former smokers by the • symbol. Low African ancestry groups are represented by a solid line and high African ancestry by a dashed line. The groups are as follows: low African current smokers (solid line with ▴ symbol), high African current smokers (dashed line with ▴ symbol), low African former smokers (solid line with • symbol), and high African former smokers (dashed line with • symbol).
