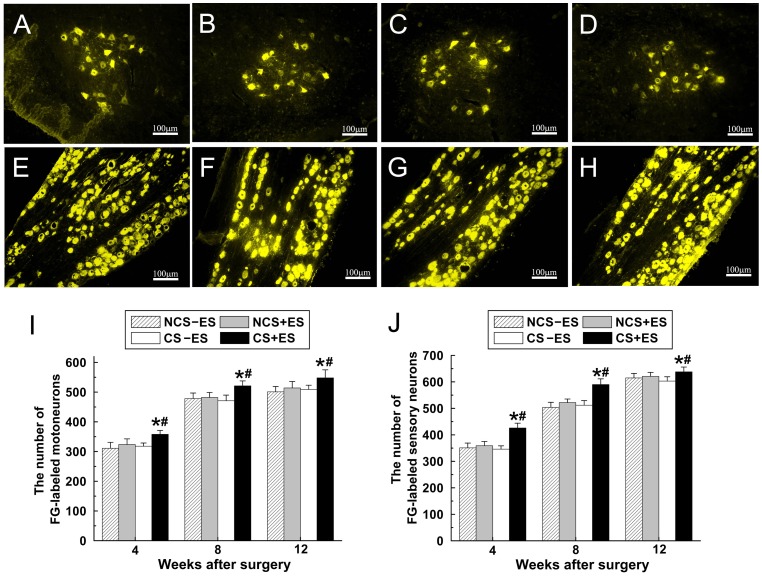
Figure 5. Representative images of FG-positive motoneurons in spinal cord (A–D) and sensory neurons in DRG (E–H) in the CS+ES group (A, E), CS−ES group (B, F), NCS+ES group (C, G) and NCS−ES group (D, H) at 12 w after surgery.
The total number of FG-positive motoneurons (I) and sensory neurons (J) which regenerated into distal nerve stump was plotted as a function of time after surgery. All data are expressed as the mean±standard deviation. *p<0.05 for the comparison with CS−ES group. # p<0.05 for the comparison with NCS+ES group.

