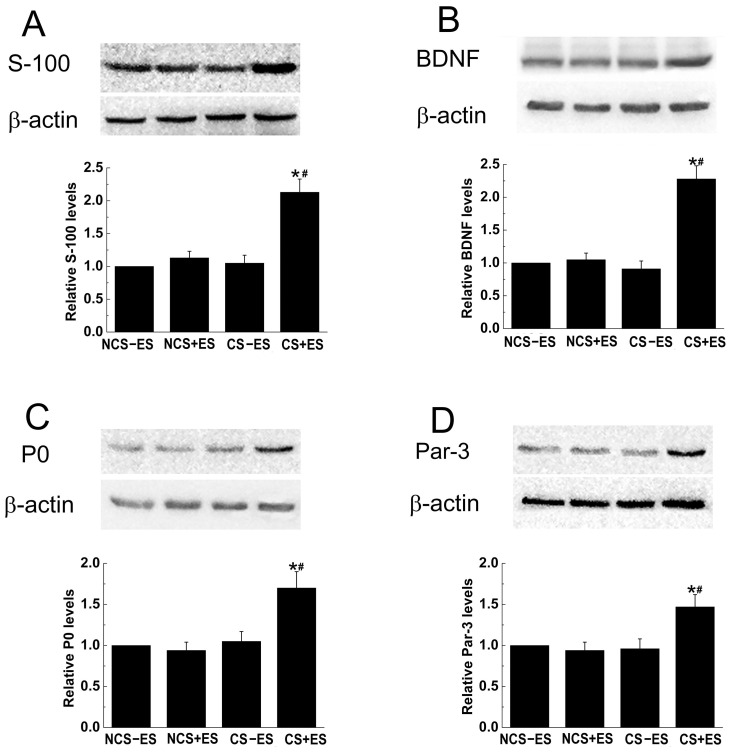
Figure 9. Protein levels of S-100 (A), BDNF (B), P0 (C) and Par-3 (D) at the site of conductive scaffold at 2 weeks after surgery.
Each test was repeated three times. The ratio of protein levels from the NCS+ES group, CS−ES group and CS+ES group to that in the NCS−ES group are shown (A, B, C and D). *p<0.05 for the comparison with CS−ES group. # p<0.05 for the comparison with NCS+ES group.

