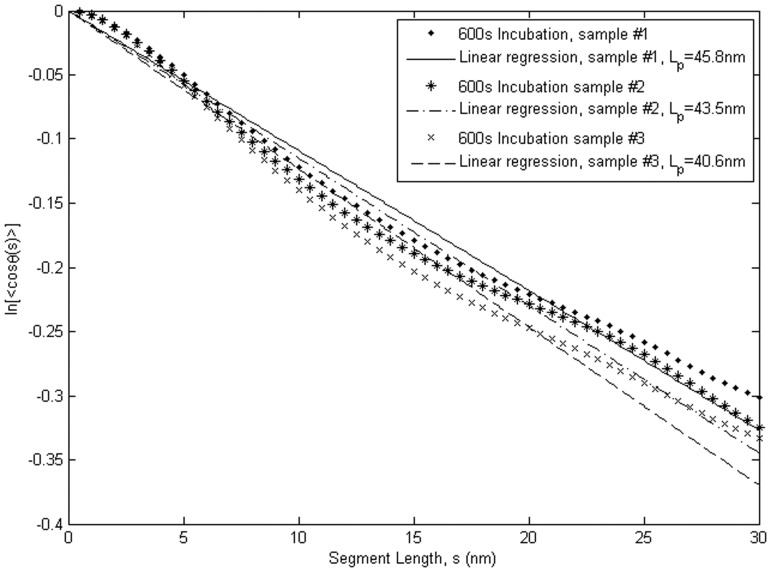
Figure 4. Tangent angle correlation analysis shows that Lp of WT human cardiac αTm equals 40.6−45.8 nm.
ln(<cos(θ)>) data obtained from three separate samples independently prepared under identical conditions are plotted as a function of segment length along the molecular contour. The slope of this plot is –1/2Lp. Lp for WT Tm from this analysis were 45.8±0.8 nm (N = 741, R2 = 0.99), 43.5±0.8 nm (N = 628, R2 = 0.98) and 40.6±0.8 nm (N = 798, R2 = 0.98). The variation in the Lp values represents the uncertainty inherent to our experimental setup and the tangent angle correlation analysis.

