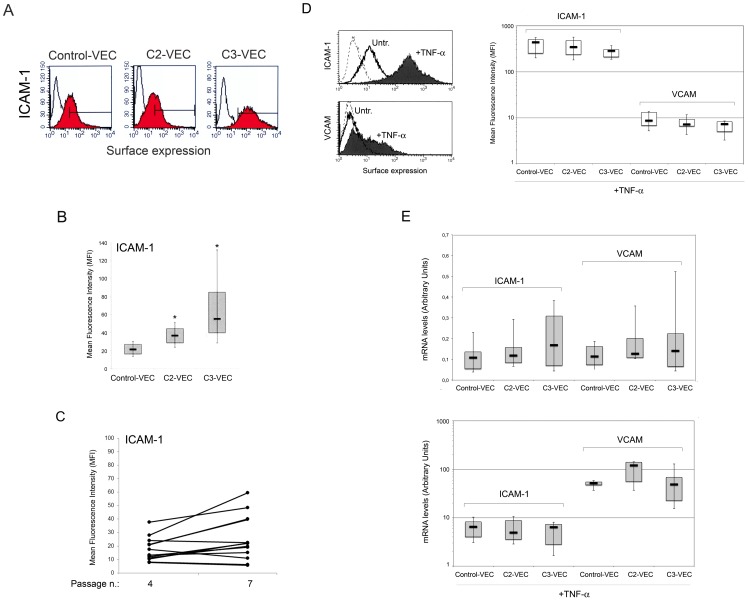
Figure 4. Analysis of ICAM-1 and VCAM expression in control and pathological VEC.
In A–C, surface expression of ICAM-1 antigen was evaluated by flow cytometry in either pathological and control-VEC. In A, colored histograms represent cells stained with monoclonal antibodies specific for the indicated antigens and white histograms represent background fluorescence obtained by staining the same cells with isotype-matched control antibodies. A representative panel for control-, C2- and C3-VEC is shown. In B, the expression levels of ICAM-1 were determined for all VEC samples (8 C2-VEC, 13 C3-VEC and 5 control VEC) by flow cytometry analysis and expressed as mean fluorescence intensity (MFI). *P<0.05 compared to control VEC. In C, comparative analysis of ICAM-1 surface expression, reported as MFI, at different VEC passages. In D–E, pathological and control-VEC cultures were exposed to TNF-α for 18 hours before ICAM-1 and VCAM surface expression analysis by flow cytometry (D), and mRNA levels analysis by quantitative RT-PCR (E). In D, two representative panels are shown: dotted histograms represent background fluorescence obtained by staining the same cells with isotype-matched control antibodies. The expression levels of ICAM-1 and VCAM, determined for all VEC samples by flow cytometry analysis upon TNF-α stimulation, are expressed as mean fluorescence intensity (MFI). In E, mRNA expression levels of ICAM-1 and VCAM were determined both in unstimulated and TNF-α-stimulated VEC cultures. Results from amplifications, done in duplicate, are expressed as arbitrary units, after normalization for the housekeeping gene. Horizontal bars are median, upper and lower edges of box are 75th and 25th percentiles, lines extending from box are 10th and 90th percentiles.

