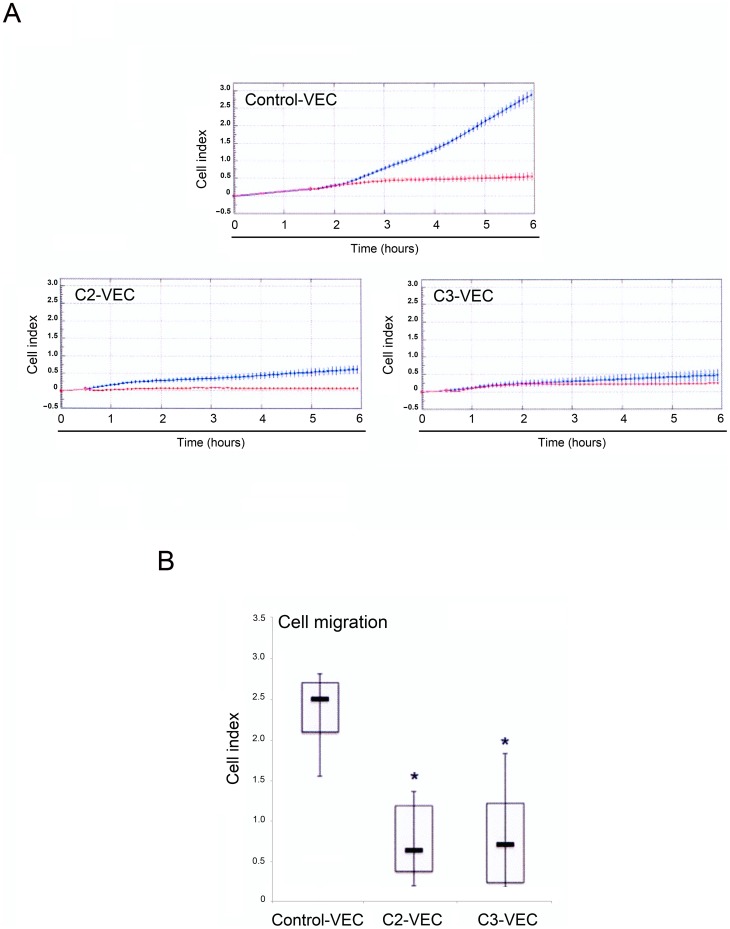
Figure 5. Differential migration kinetics between control and pathological VEC.
Control and pathological VEC cells were seeded at 2.5x10⁴ cells in fibronectin-coated 16 wells CIM-plates, and migration kinetics were analyzed in the absence or presence of 10% FBS in the bottom chamber and recorded by the xCELLigence real time cell analyzer. Cell migration was evaluated for all VEC cultures by using the recording changes in impedance and was expressed as cell index (CI). In A, representative panels of control-VEC, C2-VEC and C3-VEC migration, expressed as CI mean±SD (with samples assayed in quadruplicate), are shown. Blue lines: specific migration through FBS gradient; red lines, background migration. In B, horizontal bars are median, upper and lower edges of box are 75th and 25th percentiles, lines extending from box are 10th and 90th percentiles. *P<0.05 compared to control VEC.

