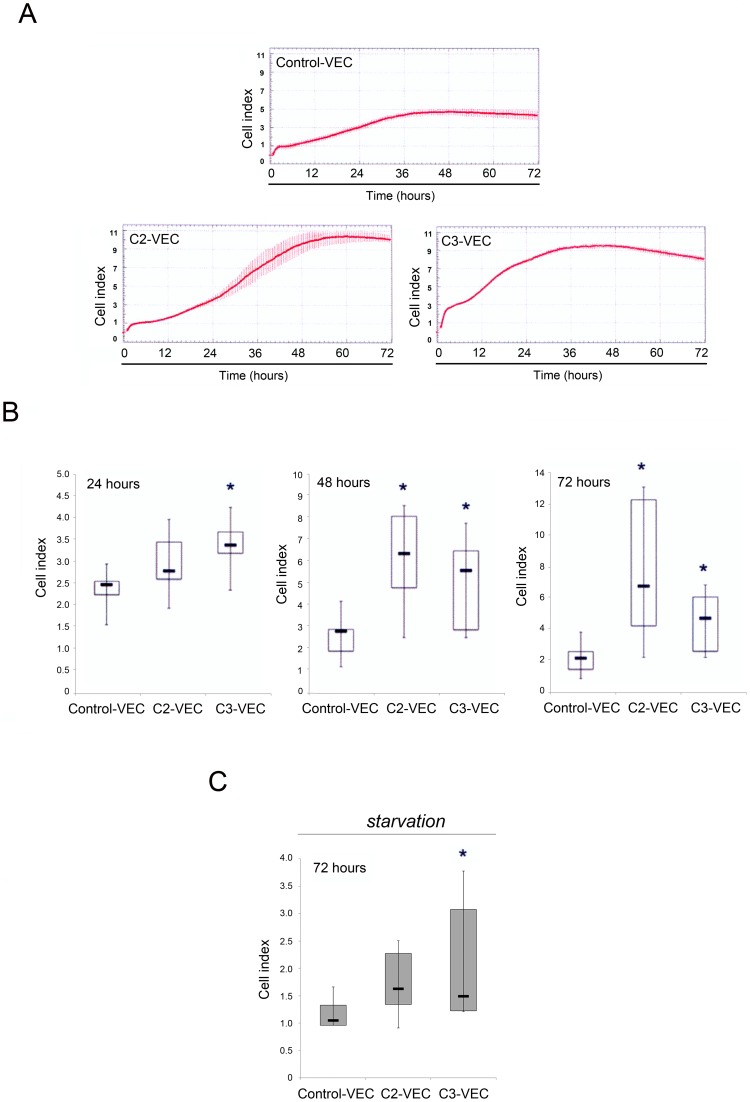
Figure 6. Differential proliferation kinetics between control and pathological VEC.
Control and pathological VEC cells were seeded in fibronectin pre-coated 16 wells E-plates and monitored using the xCELLigence real time cell analyzer (RTCA). In A–B, cell proliferation was evaluated for all VEC samples and was expressed as cell index (CI) after normalization to the CI recorded at 4 hours. In A, representative panels of control-VEC, C2-VEC and C3-VEC proliferation, expressed as CI mean±SD (with samples assayed in quadruplicate), are shown. In B, horizontal bars are median, upper and lower edges of box are 75th and 25th percentiles, lines extending from box are 10th and 90th percentiles. *P<0.05 compared to control VEC. In C, data were generated by monitoring cell index in conditions of starvation (72 hours of serum and growth factor deprivation). *P<0.05 compared to control VEC.

