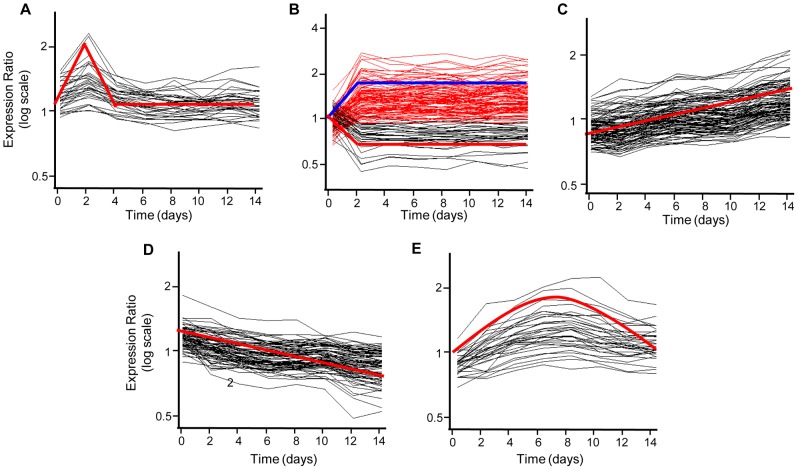
Figure 5. Profiles of Coordinated Temporal Gene Regulation.
(A–E) Clusters of temporally co-regulated genes were identified by correlation (>0.9) with synthetic profiles, indicated by red (A,B (down), C–E) or blue (B, up) lines. (A) Genes transiently induced at day 2, followed by return to control levels. B) Early induced (red) and repressed (black) genes with sustained altered transcript levels. Genes with steadily increasing (C) or decreased (D) expression levels. (E) Delayed induced genes.

