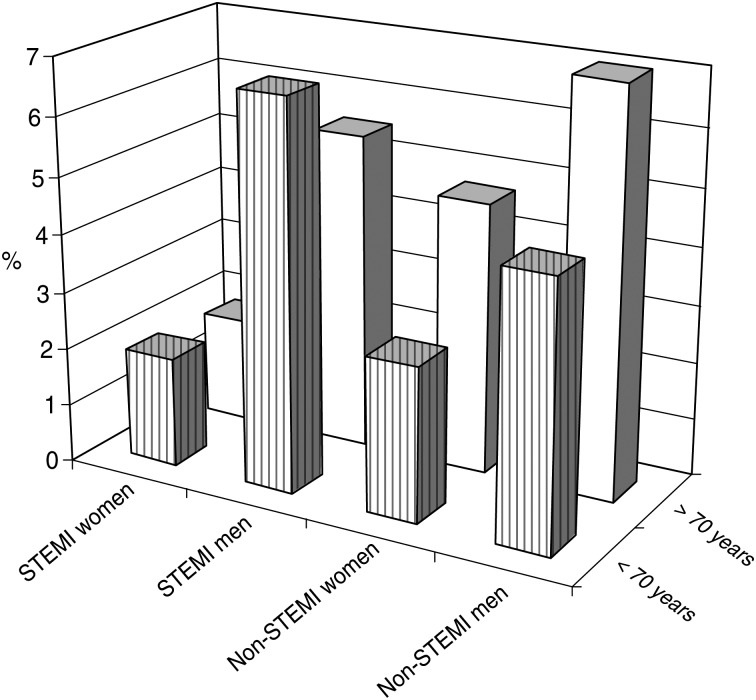
Figure 1:
Patients’ distribution between AMI groups. Percentage of patients in the STEMI group and non-STEMI group with respect to age and sex shows significantly higher values in STEMI (P < 0.001) and non-STEMI groups (P < 0.001) in men. In the group ≥70 years old, both sexes were more likely to suffer from non-STEMI (P < 0.05.)

