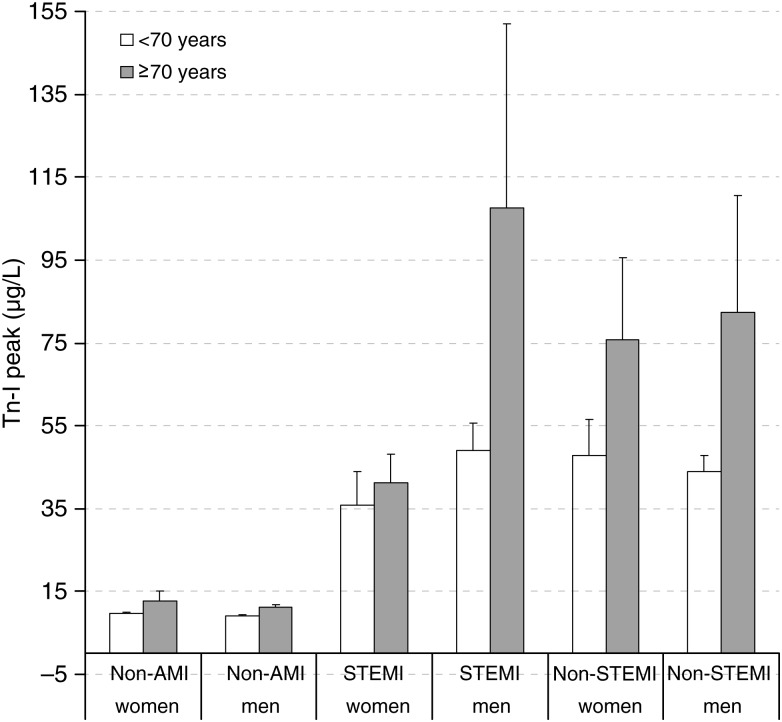
Figure 2:
Tn-I peak. Non-AMI group, STEMI group and non-STEMI group. Mean values and standard deviation for the Tn-I peak of the three groups. Lower in the non-AMI group when compared with the STEMI and non-STEMI groups (P < 0.001). Higher in patients ≥70 when compared with those aged <70 years (P < 0.05) due to the increase in men with STEMI and non-STEMI.

