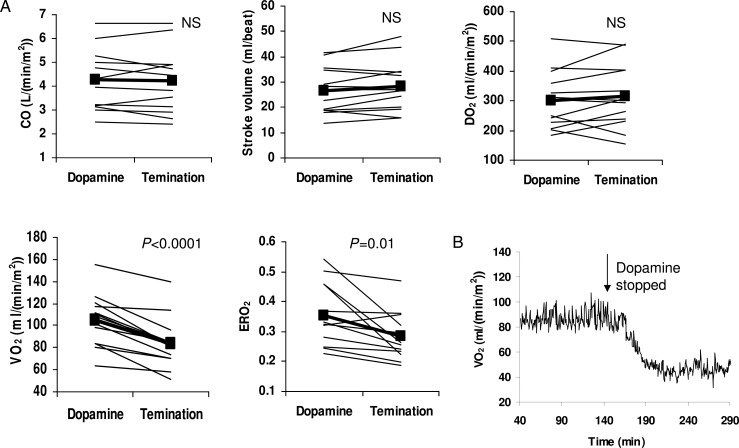
Figure 4:
(A) The individual (thin line) and mean (bold line with closed squares) changes in systemic O2transport before and after termination of dopamine following the Norwood procedure. CO: cardiac output; DO2: O2delivery; ERO2: O2extraction ratio; VO2: O2consumption. (B) An example of the on-line measurement of VO2showing the rapid decrease in VO2after terminating dopamine (7.5 μg/kg/min).

