Figure 1:

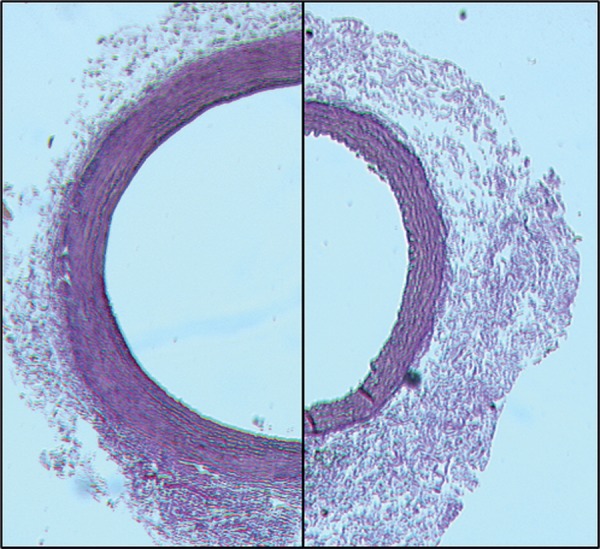
The representative light micrographs of elastase-only (left) compared with controls (right). Note the difference in the circumference.

The representative light micrographs of elastase-only (left) compared with controls (right). Note the difference in the circumference.