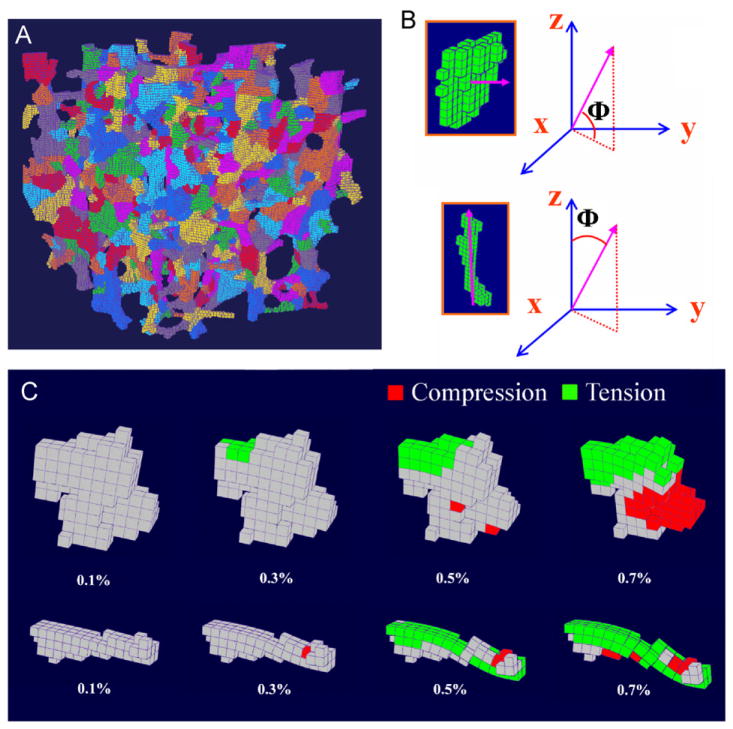
Fig. 1.
(A) Illustration of the individual trabeculae segmentation (ITS) on an image of vertebral trabecular bone sample (5 × 5 ×5 mm3); (B) definition of Φ for trabecular plates (top) and rods (bottom); (C) a longitudinal trabecular plate (top) and a transverse trabecular rod (bottom) under 0.1%, 0.3%, 0.5%, and 0.7% apparent strain. Red indicates local failure under compression and green indicates local failure under tension. The nodal displacement was amplified by a factor of 10.

