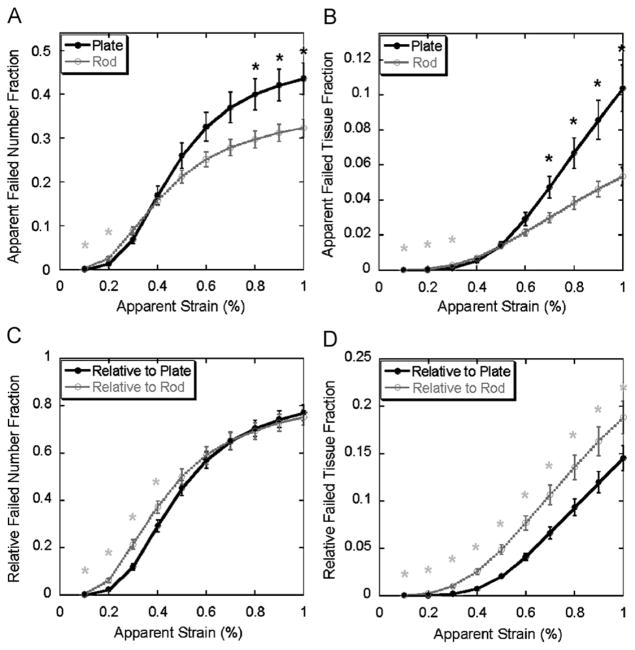
Fig. 2.
Top: apparent failed number fraction (A) and tissue fraction (B) (Mean±SE) of trabecular plate and rod under 0.1–1% apparent strain. Bottom: relative failed number fraction (C) and tissue fraction (D) (mean±SE) of trabecular plate and rod under 0.1–1% apparent strain. Light grey star indicates significantly higher failed rod fraction than failed plate fraction (p <0.05); black star indicates significantly higher failed plate fraction than failed rod fraction (p <0.05). SE: standard error.

