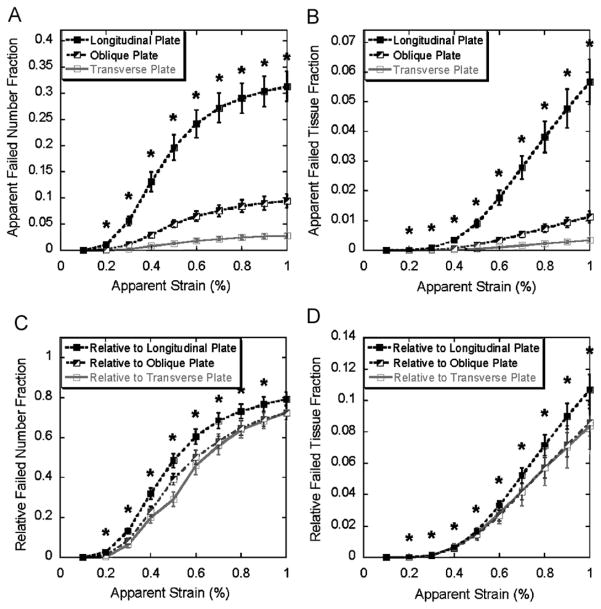
Fig. 3.
Top: apparent failed trabecular number fraction (A) and tissue fraction (B) of longitudinal, oblique, and transverse plates (mean±SE) under 0.1–1% apparent strain. Bottom: relative failed trabecular number fraction (C) and tissue fraction (D) of longitudinal, oblique, and transverse plates (mean±SE) under 0.1–1% apparent strain. * indicates significantly higher failed longitudinal plate fraction than failed oblique and transverse plate fractions (p < 0.05). SE: standard error.

