
Figure 3.
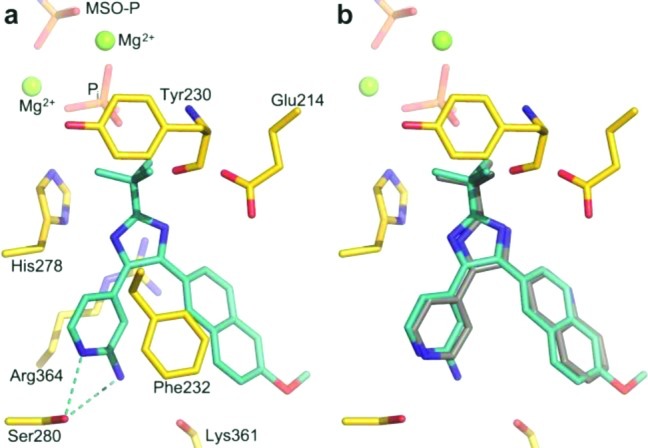
(a) MtGS (yellow carbons) in complex with 2, 11a (cyan carbons), phosphate, and magnesium. Hydrogen bonds are shown as cyan dashed lines. (b) Superposition of the protein allows comparison of binding of 3 (gray carbons) and 11a.
Official websites use .gov
A
.gov website belongs to an official
government organization in the United States.
Secure .gov websites use HTTPS
A lock (
) or https:// means you've safely
connected to the .gov website. Share sensitive
information only on official, secure websites.
(a) MtGS (yellow carbons) in complex with 2, 11a (cyan carbons), phosphate, and magnesium. Hydrogen bonds are shown as cyan dashed lines. (b) Superposition of the protein allows comparison of binding of 3 (gray carbons) and 11a.