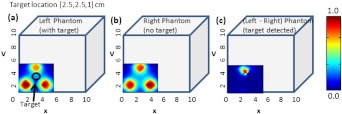
Fig. 8.
Two-dimensional surface contour plots of the detected optical intensity in the (a) left phantom with a absorption contrasted target; (b) right phantom with no target. The cubical phantom is filled with 1% Liposyn solution and the target is filled with 0.08% India Ink and 1% Liposyn solution. The studies were performed using Gen-2 imager as a simultaneous bilateral imaging (of left and right phantoms) approach. The subtracted (left—right) and calibrated surface contour plot of differential transmission is shown in (c), with the black hollow circle representing the true target location. The contour plots (a) and (b) are normalized individually for better visual representation. The scale of the subtracted contour plot in (c) was converted to a positive scale and further normalized for a distinctly visualizing the improved optical contrast from the unsubtracted image [i.e., (a)].

