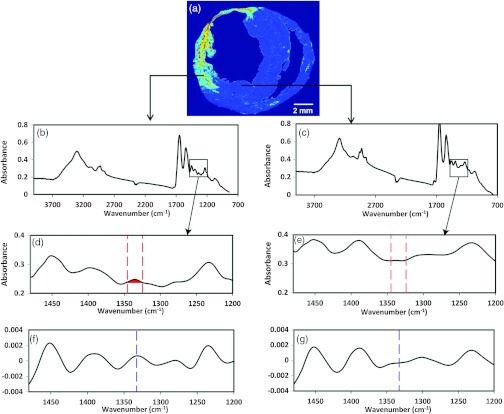
Fig. 1.
FTIR spectra of myocardial tissue. (a) Intensity image created by peak integration mapping of the absorbance band that arises from collagen sidechain vibrations. (b) Representative spectra for left ventricle within the infarct region. (c) Representative spectra for left ventricle remote to the infarct region. Expanded spectra in (d) the infarcted myocardium and (e) myocardium remote to the infarct region showing the area of integration for absorbance in (d), and the absence of the absorbance in (e). Expanded inverted second derivative spectra (multiplied by negative one to facilitate peak identification) in (f) the infarcted myocardium and (g) myocardium remote to the infarct region.

